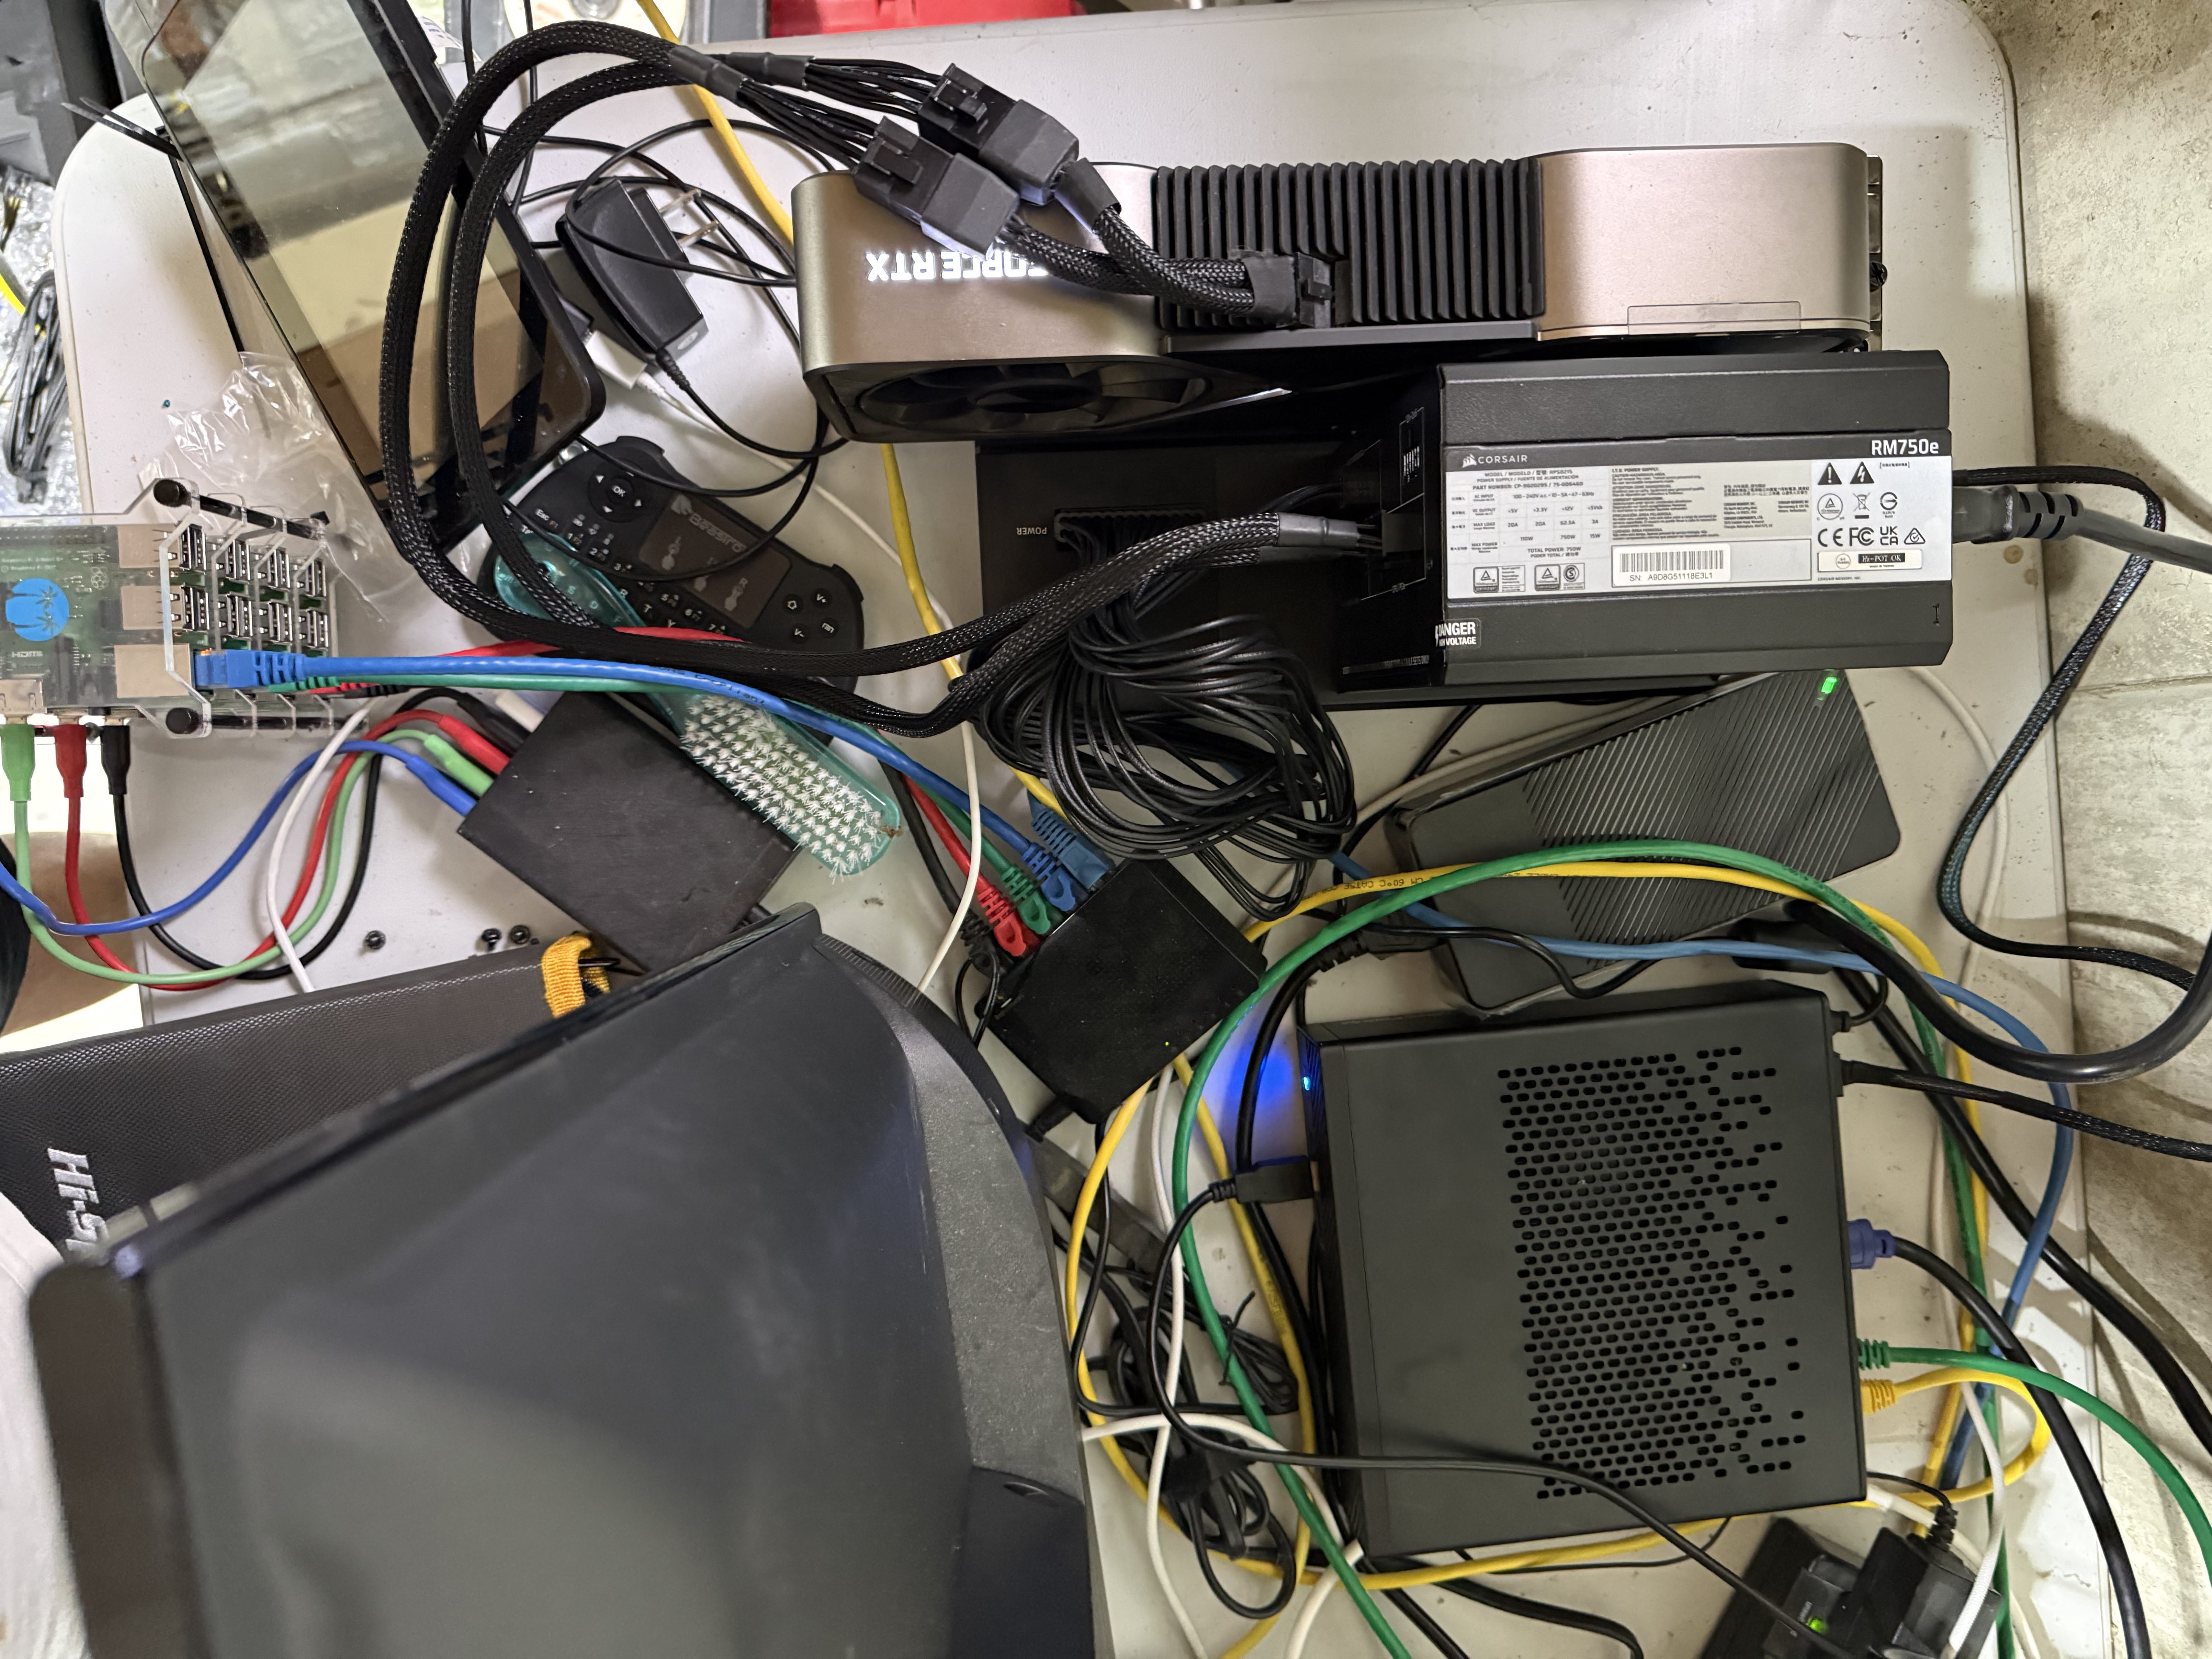


Spent the morning benchmarking my MS-A1 with the RTX 3090 on the DEG1 docking station. Benchmarking is an imperfect way to gauge the overall performance of your computer system, but it is what it is.
There are a lot of numbers here.
Benchmark Results:
Geekbench 6 Results link to my Geekbench results page. There are results for the Geekbench CPU and Geekbench AI. A note on the AI benchmark, Geekbench did not use the RTX 3090.
Sysbench
sysbench 1.0.20 (using system LuaJIT 2.1.0-beta3)
Running the test with following options:
Number of threads: 1
Initializing random number generator from current time
Prime numbers limit: 150000
Initializing worker threads…
Threads started!
CPU speed:
events per second: 147.49
General statistics:
total time: 10.0063s
total number of events: 1476
Latency (ms):
min: 6.77
avg: 6.78
max: 7.66
95th percentile: 6.79
sum: 10005.86
Threads fairness:
events (avg/stddev): 1476.0000/0.00
execution time (avg/stddev): 10.0059/0.00
sysbench 1.0.20 (using system LuaJIT 2.1.0-beta3)
Running the test with following options:
Number of threads: 16
Initializing random number generator from current time
Prime numbers limit: 150000
Initializing worker threads…
Threads started!
CPU speed:
events per second: 1178.33
General statistics:
total time: 10.0118s
total number of events: 11798
Latency (ms):
min: 9.55
avg: 13.57
max: 18.37
95th percentile: 13.70
sum: 160085.25
Threads fairness:
events (avg/stddev): 737.3750/2.39
execution time (avg/stddev): 10.0053/0.00
sysbench 1.0.20 (using system LuaJIT 2.1.0-beta3)
Running the test with following options:
Number of threads: 1
Initializing random number generator from current time
Extra file open flags: (none)
128 files, 1.1719GiB each
150GiB total file size
Block size 16KiB
Periodic FSYNC enabled, calling fsync() each 100 requests.
Calling fsync() at the end of test, Enabled.
Using synchronous I/O mode
Doing sequential write (creation) test
Initializing worker threads…
Threads started!
File operations:
reads/s: 0.00
writes/s: 657.13
fsyncs/s: 844.07
Throughput:
read, MiB/s: 0.00
written, MiB/s: 10.27
General statistics:
total time: 10.1950s
total number of events: 15178
Latency (ms):
min: 0.01
avg: 0.66
max: 20.15
95th percentile: 1.76
sum: 9978.60
Threads fairness:
events (avg/stddev): 15178.0000/0.00
execution time (avg/stddev): 9.9786/0.00
sysbench 1.0.20 (using system LuaJIT 2.1.0-beta3)
Removing test files…
sysbench 1.0.20 (using system LuaJIT 2.1.0-beta3)
Running the test with following options:
Number of threads: 1
Initializing random number generator from current time
Running memory speed test with the following options:
block size: 1024KiB
total size: 98304MiB
operation: write
scope: global
Initializing worker threads…
Threads started!
Total operations: 98304 (45177.34 per second)
98304.00 MiB transferred (45177.34 MiB/sec)
General statistics:
total time: 2.1753s
total number of events: 98304
Latency (ms):
min: 0.02
avg: 0.02
max: 0.12
95th percentile: 0.02
sum: 2167.15
Threads fairness:q
events (avg/stddev): 98304.0000/0.00
execution time (avg/stddev): 2.1672/0.00
obench Ollama benchmarks
Ollama model list
NAME ID SIZE MODIFIED
qwen3.6:35b 07d35212591f 23 GB 34 minutes ago
llama3.3:latest a6eb4748fd29 42 GB About an hour ago
llama3.1:latest 46e0c10c039e 4.9 GB About an hour ago
qwen2.5-coder:32b b92d6a0bd47e 19 GB 45 hours ago
llama3.3:70b a6eb4748fd29 42 GB 4 weeks ago
mixtral:8x7b a3b6bef0f836 26 GB 4 weeks ago
llama3.1:8b 46e0c10c039e 4.9 GB 4 weeks ago
mixtral:8x7b-instruct-v0.1-q5_K_M d011e1981bd1 33 GB 4 weeks ago
mistral:7b-instruct-v0.2-q8_0 3f321fd2a1c3 7.7 GB 4 weeks ago
llama3.2:latest a80c4f17acd5 2.0 GB 4 weeks ago
gpt-oss:20b 17052f91a42e 13 GB 3 months ago
stocks:latest d7f93a7a7fbc 19 GB 3 months ago
gemma4:31b 6316f0629137 19 GB 3 months ago
gemma4:latest c6eb396dbd59 9.6 GB 3 months ago
Benchmark results for different models.
Running benchmark 5 times using model: gemma4:31b
| Run | Eval Rate (Tokens/Second) |
|---|---|
| 1 | 36.73 tokens/s |
| 2 | 36.69 tokens/s |
| 3 | 36.60 tokens/s |
| 4 | 36.61 tokens/s |
| 5 | 36.63 tokens/s |
| Average Eval Rate | 36.65 tokens/second |
Running benchmark 5 times using model: qwen2.5-coder:32b
| Run | Eval Rate (Tokens/Second) |
|---|---|
| 1 | 37.76 tokens/s |
| 2 | 37.73 tokens/s |
| 3 | 37.60 tokens/s |
| 4 | 37.56 tokens/s |
| 5 | 37.61 tokens/s |
| Average Eval Rate | 37.65 tokens/second |
Running benchmark 5 times using model: llama3.2
| Run | Eval Rate (Tokens/Second) |
|---|---|
| 1 | 244.00 tokens/s |
| 2 | 244.66 tokens/s |
| 3 | 243.30 tokens/s |
| 4 | 243.10 tokens/s |
| 5 | 243.48 tokens/s |
| Average Eval Rate | 243.70 tokens/second |
Running benchmark 5 times using model: mistral:7b-instruct-v0.2-q8_0
| Run | Eval Rate (Tokens/Second) |
|---|---|
| 1 | 100.77 tokens/s |
| 2 | 100.71 tokens/s |
| 3 | 100.61 tokens/s |
| 4 | 101.36 tokens/s |
| 5 | 100.56 tokens/s |
| Average Eval Rate | 100.80 tokens/second |
Running benchmark 5 times using model: stocks
| Run | Eval Rate (Tokens/Second) |
|---|---|
| 1 | 35.33 tokens/s |
| 2 | 35.36 tokens/s |
| 3 | 35.37 tokens/s |
| 4 | 35.30 tokens/s |
| 5 | 35.30 tokens/s |
| Average Eval Rate | 35.33 tokens/second |
qwen3.6:35b
Running benchmark 5 times using model: qwen3.6:35b
| Run | Eval Rate (Tokens/Second) |
|---|---|
| 1 | 156.50 tokens/s |
| 2 | 156.60 tokens/s |
| 3 | 155.28 tokens/s |
| 4 | 154.33 tokens/s |
| 5 | 156.98 tokens/s |
| Average Eval Rate | 155.93 tokens/second |
Some of the models exceeded the 24Gb of memory in the RTX 3090 and split the results between the CPU and GPU with awful performance. It was just benchmarking the OCulink connection. I found that the best performance was from the qwen3.6:35b model.
Tokens per second is not an indication of better or worse performance. It does not characterize the quality of the output for a specific prompt. I have a harness to compare the results from a prompt I use for a stock report newsletter. I’ll try it out and add a new post with the results. I’ll compare the qwen3.6:35b and gemma4:31b models.
Postgres pgbench results
pgbench -j 16 -c 100 -t 10000
pgbench (16.14 (Ubuntu 16.14-1.pgdg24.04+1))
starting vacuum…end.
transaction type: <builtin: TPC-B (sort of)>
scaling factor: 1000
query mode: simple
number of clients: 100
number of threads: 16
maximum number of tries: 1
number of transactions per client: 10000
number of transactions actually processed: 1000000/1000000
number of failed transactions: 0 (0.000%)
latency average = 5.716 ms
initial connection time = 32.036 ms
tps = 17493.950636 (without initial connection time)
Leave a Reply